Generate and Export Your Results

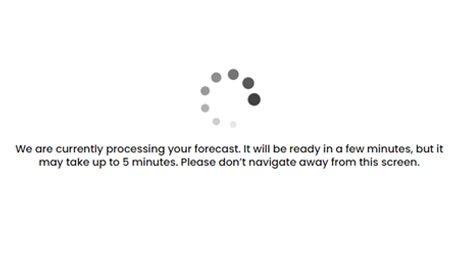
When ready, click on the ‘Generate’ button and Nventory will display this processing screen as it loads your results.

It can take up to 5 minutes for the results to appear.

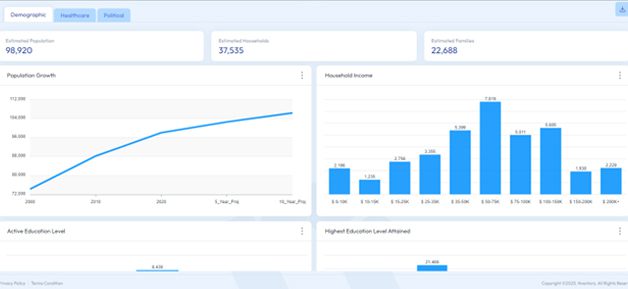
Your results will be displayed on the screen once it’s ready. On the left, you will see a list of all selections within your search area. The right will highlight your selected geo locations in blue on the map.

Below the map, you will see the three tabs: ‘Demographic’, ‘Healthcare’, and ‘Political’.  ‘Healthcare’ and ‘Political’ are premium subscription based services and data sets.

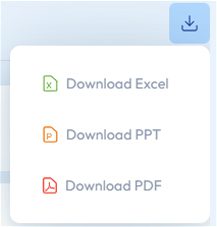
To export the results under the selected tab, click on the Download icon in the upper right and choose the file type that you would like to export your report in.

Scrolling down on the results screen, you can see the demographics of your selected area.

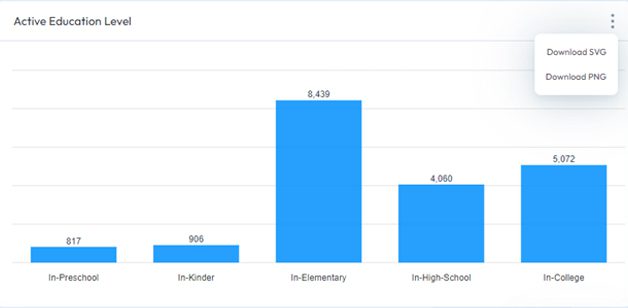
Each graph can be downloaded individually as either an SVG or PNG file.

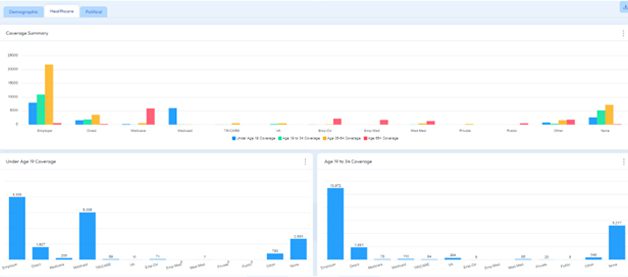
For the Healthcare tab, you will be provided with data on the following areas:

  • Coverage Summary
  • Under Age 19 Coverage
  • Age 19 to 34 Coverage
  • Age 35-64 Coverage
  • Age 65+ Coverage

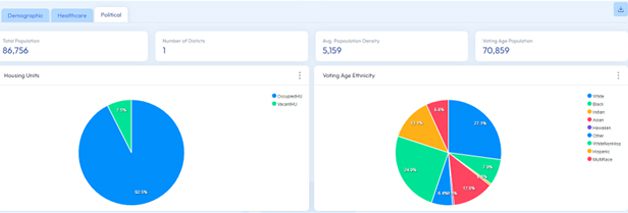
For the Political tab, you will be provided with data on the following areas:

  • Housing Units
  • Voting Age Ethnicity
  • 2020 Presidential Election
  • Voting Age Gender
  • District Representative Information

Yielding progressive results with
agile methodology

  • Audit Analysis
    and Discovery
    1 - 2 weeks
  • Proposal
    of Strategy
    1 - 2 weeks
  • Onboarding and
    Implementation
    4 weeks onwards
  • Testing and
    Proof of Concept
    1-3 weeks
  • Launch
    Pre-Go Live Test
    2 weeks
  • Analyze and Optimize
    Ongoing

Take the next step